
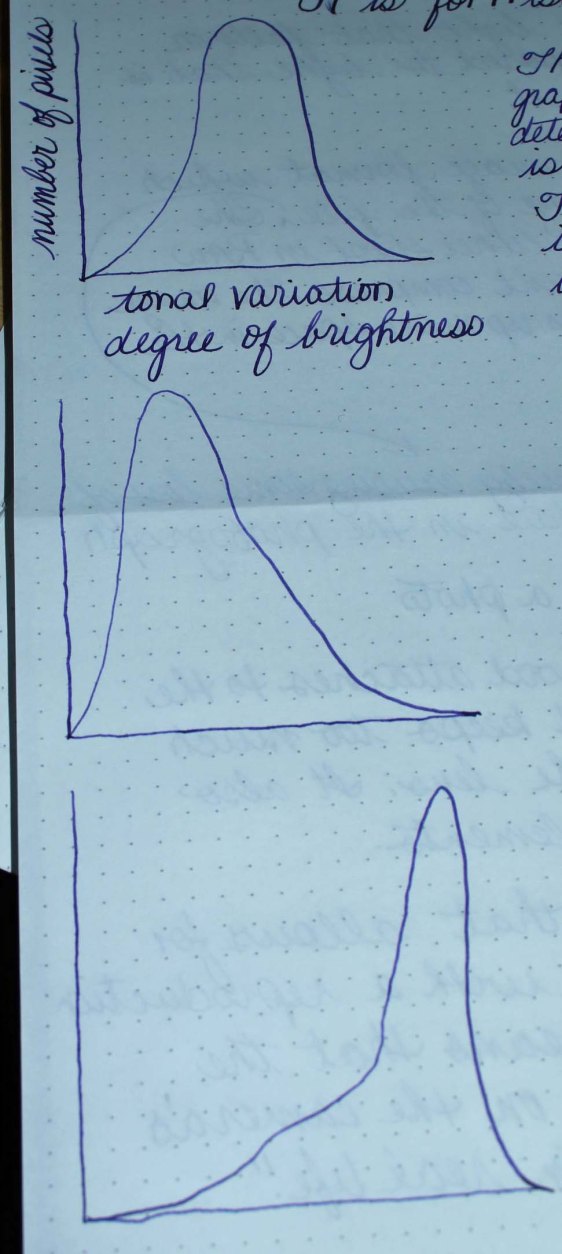
Very badly drawn histograms — no wonder I didn’t excel at math!
A histogram is a graph which helps you determine if a photo is properly exposed. The ideal histogram is shaped similarly to a bell curve (the graph on the top).
If it skews more to the left, your photograph is underexposed, and if it skews more toward the right, you’re overexposed. Your photos may trend one way or the other and still be properly exposed, but what you’re ideally looking for on a histogram is an even distribution of pixels across the light spectrum.

Pingback: T Is For Tonal Range | Jen's Rambling Thoughts